Check the latest global hospitality statistics for 2023, including review volume evolution, impact scores, and defining trends shaping the travel industry. [updated quarterly]
TrustYou Q3 2023 Global Hospitality Statistics
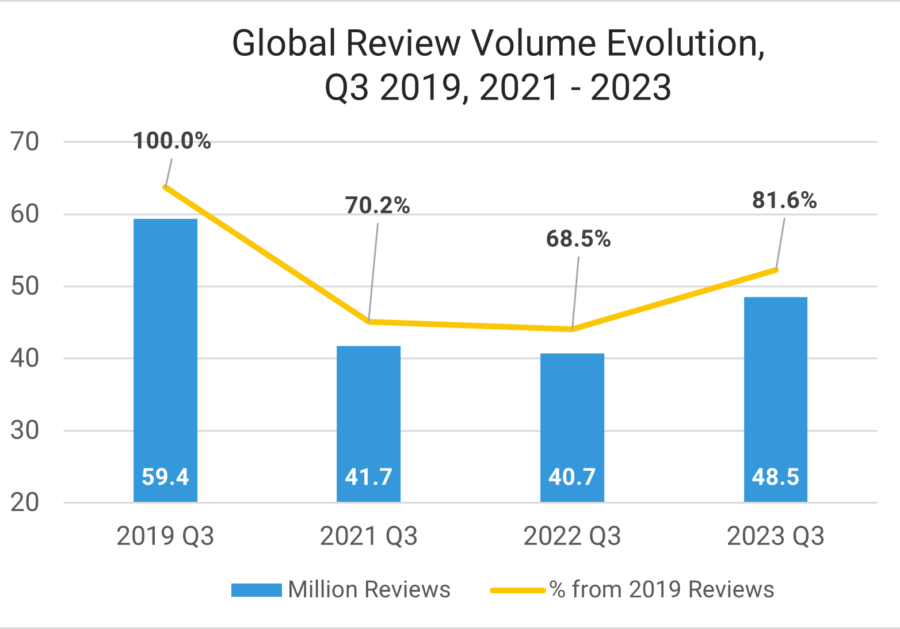
#1 Global Review Volume Continues to Increase
The Q3 2023 review volume reached 81.6% of the 2019 levels and recorded a 19.2% increase compared to Q3 2022.
In Q3 2022, the review volume was 68.5% of 2019 reviews. Compared to January-March 2023, the review volume increased by 22.5%.
Other travel indicators show a similar growth pattern. In August 2023, the total amount of air travel, as measured by revenue passenger kilometers (RPKs), increased by 28.4% compared to August 2022. This represents 95.7% of the 2019 levels.
Specifically, domestic air travel in August 2023 experienced a 25.4% increase compared to the same month in 2022 and 9.2% higher than in August 2019. The strong demand for domestic flights in China mainly influences this significant growth.
For international air travel, there was a 30.4% rise compared to the same period last year and 88.5% of the August 2019 levels.
We noticed that review volume growth is slower than other indicators, such as the number of international arrivals or hotel bookings. Not all guests choose to leave reviews after their stays. Since many other tourist providers are looking for travelers’ feedback, consumers have become more selective in leaving reviews, choosing to share only the best or worst experiences they had. That’s why it’s crucial to send live or post-stay surveys to capture more of your guests’ opinions.
35.1% of travelers reading guest feedback are not leaving reviews because they are unaware of a survey or don’t know where to leave a review.
#2 Positive Feedback Remains High
93% of global guest reviews are positive.
In 2022, 92% of all feedback was positive. Hoteliers prove that providing a top-notch guest experience remains a top priority.
Why You Need an AI Response Generator
Here’s how an AI response generator for your guest reviews will help you save time & money while improving the guest experience.

#3 Service and WiFi Continue to Shape Guest Satisfaction
Impact Scores use review data to determine how different factors affect the scores that guests leave. This is accomplished through semantic analysis, which extracts relevant information from reviews and estimates the impact of factors such as room maintenance on performance scores. Impact Scores are divided into positive and negative scores, and different categories such as service, WiFi, parking and location are used to determine how many points can be lost or gained in each category.
Here are the key categories driving performance in Q3 2023:
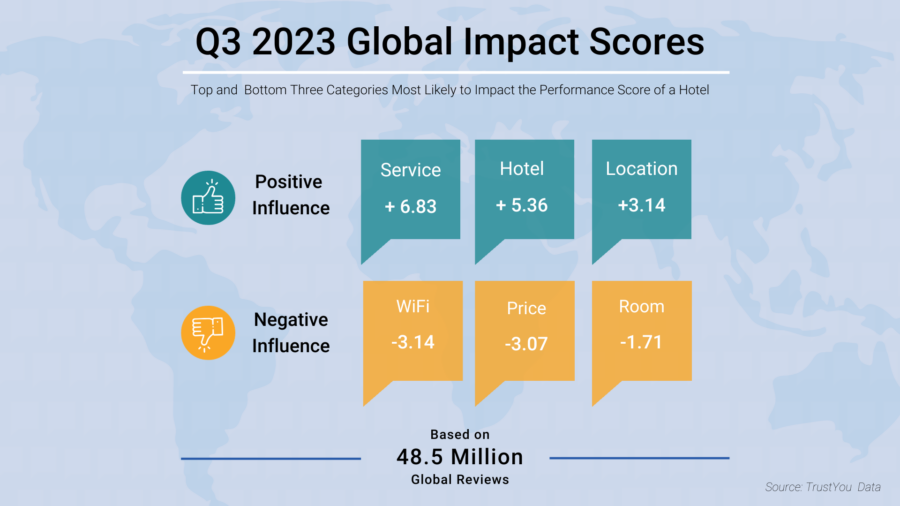
The global impact scores haven’t changed compared to Q2 2023. Service, Hotel and Location continue to drive positive reviews. WiFi, Price, and Room brought lower scores in Q3 2023.
Certain subcategories emerged as new drivers for guest satisfaction. As an example, Water Park Hotels were among the top two factors highly appreciated by the guests for the category Hotel.
On the negative side, Room Maintenance was most likely to be a challenge and bring lower scores for the category Room.
Industry Wrap-Up – Q3 2023 Global Hospitality Statistics
#4 Tech Adoption as a Way to Cope with Staff Shortages
Staff shortages are an ongoing challenge for the industry. According to a recent study by Deloitte, 53% of hoteliers are currently at 25-74% of their pre-pandemic workforce, and less than 10% expect to be completely staffed by the end of 2023.
Technology adoption plays a crucial role in minimizing the impact of labor shortages. Half of hotel respondents are implementing new technology, 43% automate repetitive tasks, and 39% upgraded the existing tech stack. However, hoteliers are still reluctant about the existent solutions – 54% say that what’s available on the market tech-wise is not advanced enough to cover their needs.
#5 Double-digits Growth for the Key Hotel Indicators
Amadeus recently released a report revealing that the global hotel occupancy rate is 10% higher compared to 2022, and the growth will continue by the end of the year.
The global RevPAR (revenue per available room) increased by 17% (January – September 2023) compared to last year. France registered the highest growth in RevPAR – 123%.
#6 Today’s Guests Expect a Connected, Seamless Hotel Experience
A recent report by Hospitality Planet looks at key traveler behaviours from pre- to post-stay. Here are a few key findings:
- 49% of guests would choose to be checked-in by the staff, 32% prefer a self check-in on a personal device, and 15% – a self check-in available at a hotel kiosk.
- Only 37% of returning guests say their info is saved in the hotel system. For those choosing to rebook, discounts (48%) are the most important reward, followed by loyalty points (40%).
- 56% of respondents consider WiFi as the most vital service. Globally, 55% prefer to have access to an open WiFi.
TrustYou Q2 2023 Global Hospitality Statistics
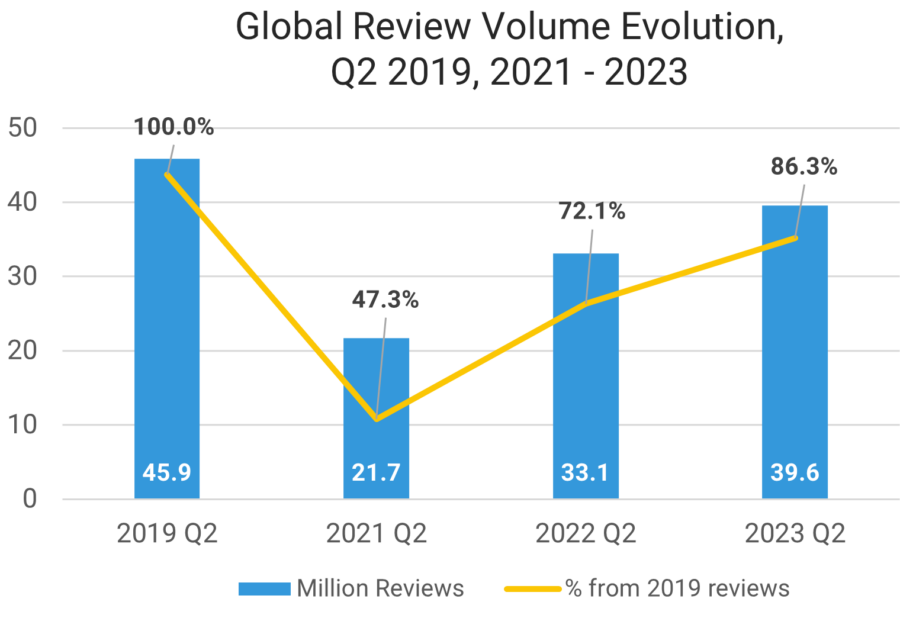
#1 Global Review Volume Getting Closer to 2019 Levels
The Q2 2023 review volume reached 86.3% of pre-pandemic levels and recorded a 19.6% increase compared to Q2 2022.
In Q2 2022, the review volume was 72.1% of 2019 reviews. Compared to January-March 2023, the review volume increased by 32.4%.
The global review volume is in line with other travel indicators. The International Air Transport Association (IATA) estimated that global air traffic reached 90.5% of pre-pandemic levels in April 2023 and 96.1% in May 2023. Domestic traffic has fully recovered and showed a 2- to 3% increase compared to 2019.
Other indicators have even surpassed pre-pandemic levels. Every month,Skift calculates a Travel Health Index to assess the sector’s progress. It’s based on 84 key measurements from 22 data partners, including TrustYou. In April 2023, it was the first time that the travel health index reached pre-pandemic numbers. In June 2023, the index surpassed the 2019 level.
This progress is attributed to China’s comeback to the travel scene, various global celebrations, especially in April, and the beginning of the vacation season.
#2 Positive Feedback is Steadily High
93% of global guest reviews are positive.
In 2022, 92% of all feedback was positive. Hoteliers prove that increasing guest satisfaction and experience remains a top priority.
Whether you are looking for ways to reply to more positive reviews or address the issues flagged by your guests, TrustYou’s new feature, responseAI, will help you respond efficiently and genuinely. With our latest feature, you can reduce the time spent replying to reviews while keeping that human touch. responseAI is smart enough to detect a positive or negative review, personalize the message, translate, and just like that – it’s ready to review and send!

#3 Service Improves Scores; WiFi Brings Lower Ratings
Impact Scores leverage all review data for hotels, and fill in the gaps between what people say and how that impacts the scores they leave. With the help of semantic analysis, we extract all relevant data from all reviews. This way, we can estimate the impact that, for example, room maintenance had on a performance score in a particular period. These scores reflect different semantic categories (Service, WiFi, Parking, Location, etc.)
Impact Scores are split into negative and positive. For each category, we show how many points you can lose or gain from your performance score.
Here are our key findings for Q2 2023:

The top and bottom three global impact scores give a general overview of what hotels must focus on to drive their performance. Service, Hotel, and Location positively influenced hotel performance while WiFi, Price, and Room had negative impacts, decreasing performance.
Certain subcategories had a significant impact on the overall rating of hotels.
When the staff was friendly and the management team helpful, guests were more inclined to give higher scores. Boutique and Sports hotels stood out as popular choices within the Hotel category. Additionally, travelers expressed appreciation for hotels situated close to attractions, restaurants, and bars, emphasizing the importance of Location.
Conversely, a hotel could have received lower scores if the WiFi connection was poor or the property charged for WiFi. For the Price category, food prices could also cause travelers to leave lower scores. For the category Room, travelers paid extra attention to bathroom cleanliness.
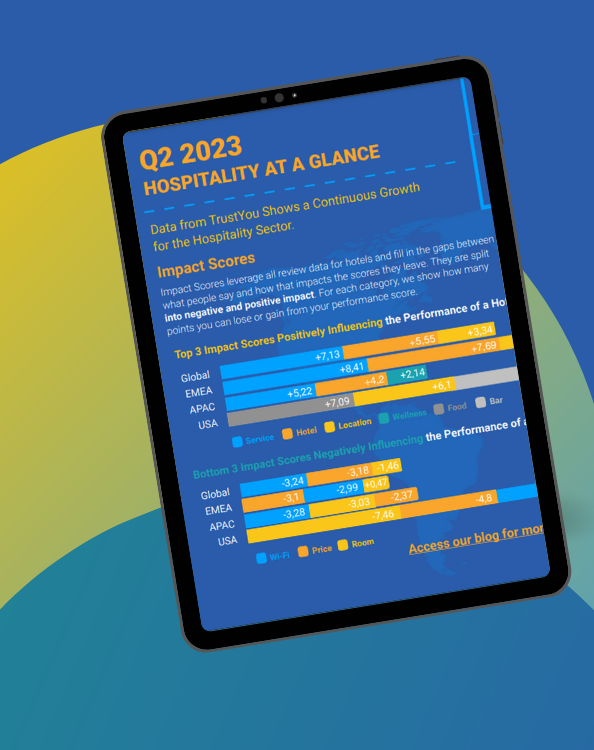
Q2 2023 Hospitality at a Glance
All you need to know about how hospitality evolution – in one page. Access our exclusive infographic summarizing global and regional review volume, categories impacting performance, and review sources.
Industry Wrap-Up – Q2 2023 Global Hospitality Statistics
#4 International Tourism Contribution to Reach 95% of 2019 levels by the end of 2023
The latest forecast by the World Travel & Tourism Council estimates that the sector’s contribution to the GDP will reach $9.5 TN, with 34 countries already surpassing pre-pandemic levels. The same recovery percentage is expected for the hospitality job sector.
#5 Leveraging Google’s New Tools: GA4 and Performance Max
Holding more than 90% of the search market share, Google is undeniably an essential platform for the travel industry.
Two major tools that impact the industry have been released this year – PerformanceMax for the advertising side, and Google Analytics 4 (GA4) for the analytics side.
PerformanceMax is a tool powered by AI that enables hotel marketers to generate ads in various formats and expand their reach to a larger audience across Google’s platforms. Google claims that Performance Max can increase the conversion rate by 18%, compared to other traditional formats at the same cost. From the first results reported by Google, a hotel in Greece increased its revenue by 32% and its direct bookings by 26% after using PerformanceMax for one month.
While PerformanceMax is especially relevant for hotels, GA4 affects every business worldwide. The official release was on July 1st, with companies preparing for the transition at least a few months earlier. Replacing Universal Analytics, GA4 approaches the user’s journey differently, offering event-based insights into how they interact with your platform.
Whether you’re a hotel, OTA, or destination – configuring GA4 properly is essential for getting more insights into your visitors’ journeys, improving their experience, and increasing conversions.
#6 How Consumers Decide to Travel and Book – Insights from Expedia’s Research
Expedia’s latest report provides valuable insights for the travel industry into how consumers are planning and booking their trips. Here are a few key findings:
- 45 days before booking, travelers view, on average, 141 pages of travel content
- The top three types of resources used by travelers in their decision-making process are OTAs – used by 80%, search engines – 61%, and social media – 58%
- When looking for inspiration, these are the top three resources travelers access: Social media – 77%, Travel blogs & review websites – 49%. Destination’s website – 45%
TrustYou Global Hospitality Statistics Q1 2023
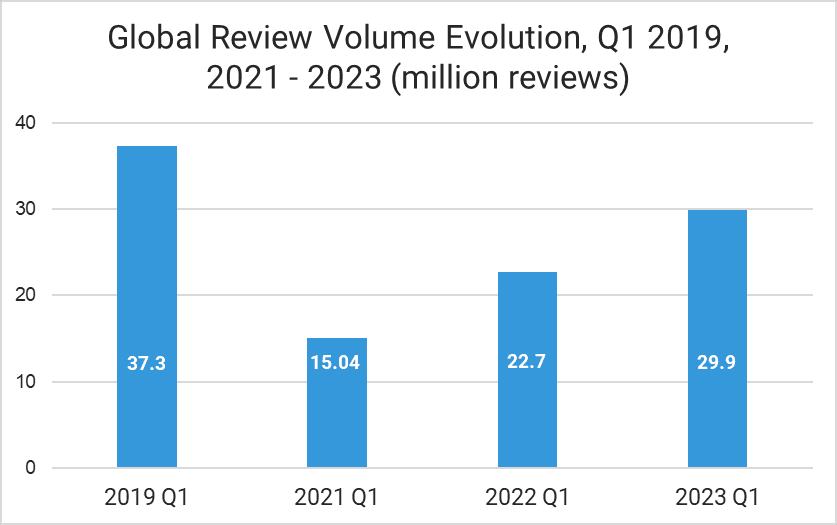
#1 Global Review Volume Growth Continues in Q1 2023
Q1 2023 review volume reached 80.2% of the pre-pandemic level and recorded a 31.7% increase compared to Q1 2022.
In Q1 2022, the review volume was 60.8% of 2019 reviews. At this accelerated pace, the review volume could surpass pre-pandemic numbers by the end of 2023.
Looking at the numbers provided by leading travel and tourism organizations, we see that review volume aligns with other recovery indicators. IATA reported that global air traffic was 84.2% in January and 84.9% in February 2023 of 2019. China’s decision to scrap the Zero-COVID policy mainly contributed to this growth.
Other indicators show a strong beginning. Based on Key Data’s latest insights, the global ADR for Q1 2023 increased by 3.4%, occupancy by 17.6%, and RevPar by 21.6%.
#2 Positive Feedback is Steadily High
93% of global guest reviews are positive.
In 2022, 92% of all feedback was positive. Hoteliers prove that increasing guest satisfaction and experience remains a top priority in the post-pandemic scene.
A Live Survey Solution is a great way to reduce negative feedback. With an on-site survey, hoteliers can solve issues on the go, increasing guest satisfaction and preventing negative reviews.
#3 Service Improves Scores; WiFi Brings Lower Ratings
Here are our key findings for Q1 2023:
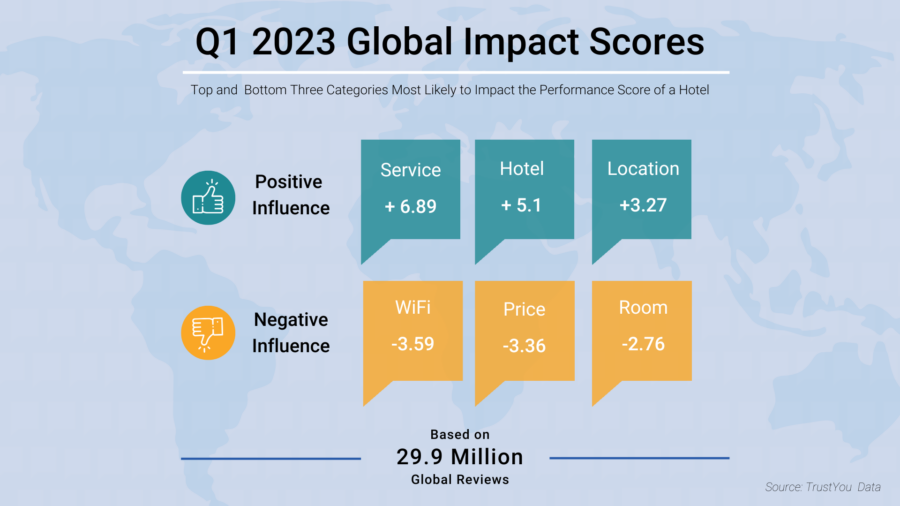
The top and bottom three global impact scores give a general overview of what hotels must focus on to drive their performance. Service, Hotel, and Location were the categories that positively influenced hotel performance. On the other hand, WiFi, Price, and Room were negative impacts, decreasing performance.
We looked further into our data and found that specific subcategories significantly influenced a hotel’s overall rating.
Guests were likelier to leave higher scores if the staff was friendly and the management team helpful. Boutique and Water Park hotels were popular in the category Hotel. For the Location, it was all about convenience based on the travelers’ needs and what they could sightsee nearby.
Conversely, a hotel could have received lower scores if the WiFi connection was poor or the property charged for WiFi. For the category Price, the value for what they paid was crucial for travelers. Maintenance and cleanliness were most likely to bring lower scores for the category Room.
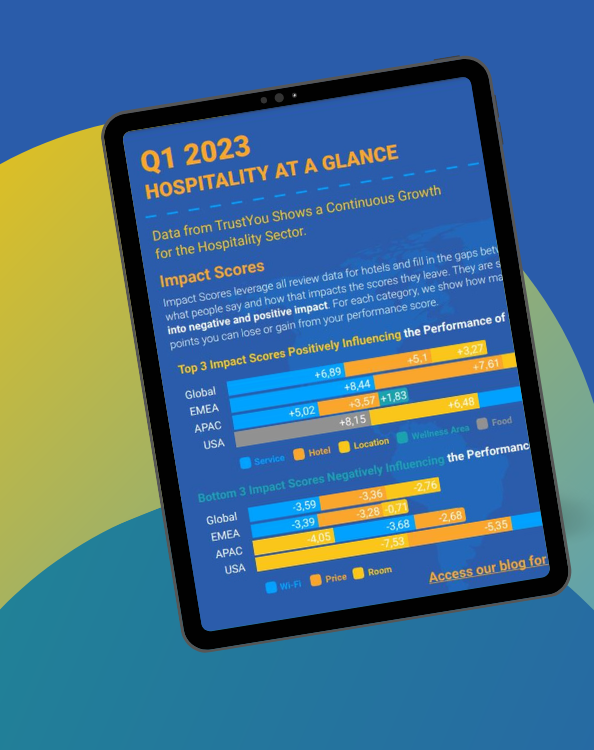
Q1 2023 Hospitality at a Glance
All you need to know about how hospitality evolution – in one page. Access our exclusive infographic summarizing global and regional review volume, categories impacting performance, and review sources.
Industry Wrap-Up – Global Hospitality Statistics Q1 2023
#4 Travelers Still Look for Health & Safety Measures and Flexible Options
Criteo surveyed more than 12k travelers globally to see how they want to plan their travel experiences and what they expect from the travel industry in 2023. Here are a few findings:
- Travel budgets don’t shrink this year. Despite the price surge, travelers aren’t reducing their travel budgets in 2023. Instead, they are looking for ways to optimize their costs by paying more attention to deals and loyalty programs. Our analysis of 29.9 million guest reviews also confirms that price is on the top agenda for travelers. It’s the second factor that can bring lower ratings for a hotel, with guests more inclined to leave negative reviews when unsatisfied with the value or if an accommodation charges WiFi costs.
- Travelers still appreciate health & safety measures despite most of the world reopening. Our Q1 2023 analysis confirms these findings. Room maintenance and cleanliness are among the key features most likely to bring lower scores to a hotel.
Keeping Up with the Ever-Changing Guest Expectations
Jurys Inn started to use TrustYou at a very challenging time for the industry. During COVID-19, the platform allowed them to monitor their guests’ needs, identify new trends, and keep up with the evolving expectations around cleanliness.

- Flexibility is key. 59% of travelers consider the free cancellation policy when choosing a travel service, and 42% the refund options.
- A rising preference for seamless and customized vacations. In January 2023 only, the conversion rate for package tours grew by 96% compared to 2022 and 105% compared to January 2020, just before the lockdowns.
#5 Who Are Modern Travelers and How Will They Evolve in the Next Decade?
At the beginning of 2023, Amadeus launched a comprehensive research report on the behaviors that will define travel in the next decade.
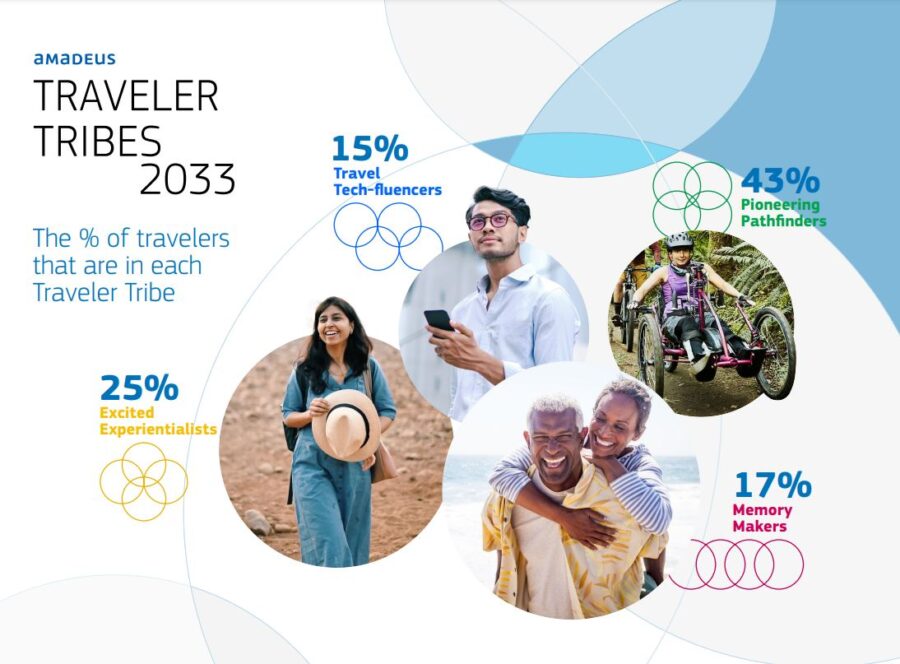
Based on more than 10.3k survey replies, Amadeus identified four types of travelers:
- Pioneering Pathfinders – earning a higher-than-average income, most of the Pioneering Pathfinders are either Millenials or Gen Zs. They are calculated risk takers – not afraid of trying new things as long as they’ve done their research. This tribe is driven more than others to prioritize sustainability over comfort when traveling.
- Excited Experientialists – most travelers from this group don’t live with children and have a medium to high income. They base their traveling decisions on YOLO (You Only Live Once), often acting instinctually than rationally. They are comfortable with ambiguity and rely less on technology to manage their plans.
- Memory Makers – Gen X and Baby Boomers are among the most prominent age groups in this tribe, with low to medium incomes. Memory Makers are characterized by stability and are the most worried about change. Regarding technology, they use the essentials and are not as excited as other tribes about innovations or apps.
- Travel Tech-fluencers – these are Millenials or Gen Zs currently traveling for business purposes, with medium income. Their lifestyle is tech-driven, with most tech-fluencers owning a VR, using cryptocurrency, or using a wellness app. In 10 years, they plan to travel less for business and be among the first to try new ways of experiencing trips.

How Different Generations Interact with Guest Reviews
TrustYou’s latest consumer research reveals how hotels and destinations can adapt their offering for younger and older travelers.
Use Guest Reviews to Attract More Happy Travelers
Happy travelers spend more, book again, and promote your brand. How do you increase your visitors’ satisfaction as a hotel, destination, or booking platform?
TrustYou offers a powerful tool for the hospitality industry that helps attract more visitors and improve guest satisfaction. With the help of our all-in-one reputation management platform, you can collect and analyze feedback from guests, identify improvement areas and address issues promptly. This leads to increased guest satisfaction, positive reviews, and, ultimately, more bookings. Our guest experience solution platform allows you to engage with guests before, during, and after their stay, fostering a sense of connection and building trust.
Get Your Demo with TrustYou
See an overview of the world’s leading all-in-one platform, including reputation management, review marketing, and guest surveys. You’ll see firsthand how to make better business decisions for your organization, earn trust, and succeed.

*The requested Q1 2023 top and bottom Impact Scores reflect the main semantic categories.
** Q1 2023 Impact Scores and Review Volume were requested at the beginning of April 2023. Due to the dynamic nature of the database with reviews and hotels being updated, the numbers may vary if data were requested at an earlier or later stage.
***the report includes rounded numbers for a clearer data representation.

